Daily Technical Analysis by PipSafe
Technical analysis of USDCHF dated 26.02.2014
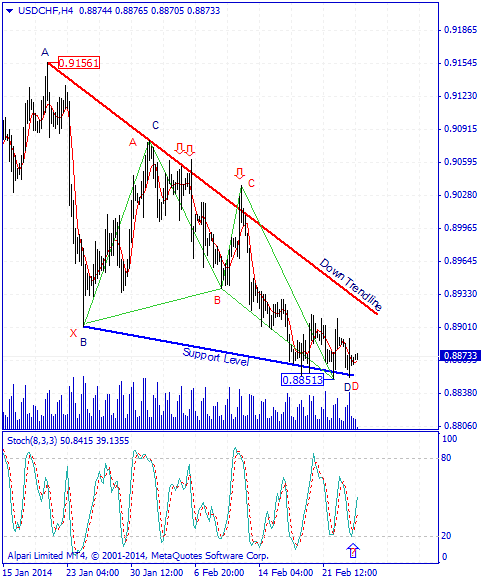
USD/CHF was in a downtrend during the recent weeks that sellers were successful in obtaining the lowest price of 0.88513.Currently price in long term time frames such as monthly , weekly and daily is under 5-day moving average and warns more descending in long term interval.In the H4 time frame, right now, the descending trend of the price has been stopped when the price reached the blue supportive line and the it formed the third bottom price on this line. There are two candle pattern on this line, Hammer and Spining top, which are good proves of sellers’ defeat to reach the lower prices and then formation of a bottom price
As it is obvious in the picture below, there is AB=CD harmonic pattern(also Butterfly Harmonic Pattern) with ratios of 61.8 and 127.2 between top price of 0.91561 and the bottom price of 0.88513 that warns about changing price direction from the D point of this pattern.Stoch indicator in daily time frame (also in 4H time frame) is in saturation sell area and with the next cycle warns about ascending of price during the next candles.Generally until the bottom price of 0.88513 is preserved, the price has the potential for ascending in this currency pair.
Technical analysis of AUDCAD dated 27.02.2014
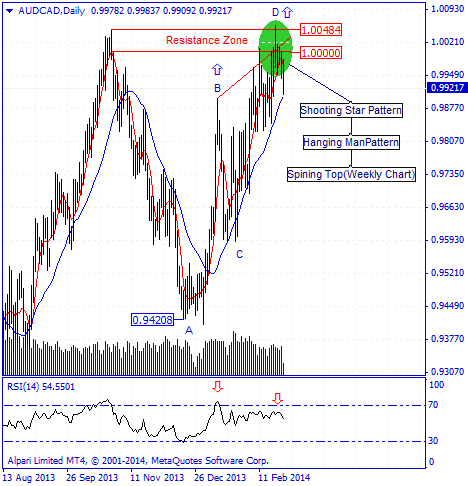
AUD/CAD pair from the end of 2013 till now was in a uptrend( with price reformation )that shows buyers determination to achieve predetermined targets. Buyers were successful to achieve the highest price level of 1.00594.Currently price in daily ad h4 time frames is under 5-day moving average that shows descending of price during the net candles.As it is obvious in the picture below, there is an AB=CD harmonic pattern between the bottom price of 0.94208 and the top price of 1.00594 with Non- ideal ratios of 61.8 to 127.2 that warns about descending of price from the D point of this pattern.RSI indicator is in saturation buy area and in divergence mode with the price chart and confirms the top price and warns about changing price direction during the next candle.Generally until the top price of 1.00594 is preserved, there is a potential for descending and price reformation in this currency pair.
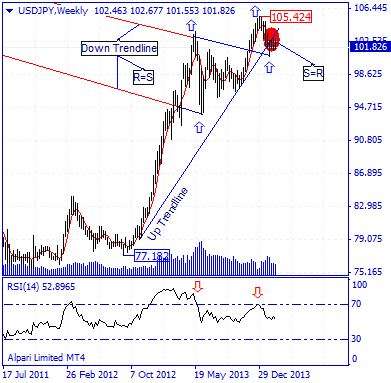
USD /JPY pair from the end of 2012 till now was in a strong and without reformation uptrend that shows buyers determination to achieve predetermined targets. Price during the recent uptrend was able to record the highest price of 105.424 which is possible to convert to a top price in Monthly time frame.During the Down trend from Top price of 105.424, price with reaching to the uptrend line and breaking of it did not qualify for descending. In the return of Price, the uptrend line’s property is reversed and as a Resistive line is impressive on price(S=R).Right now in Daily and H4 time frames, the price is under 5-day moving average that shows the descending trend and warns about more descending
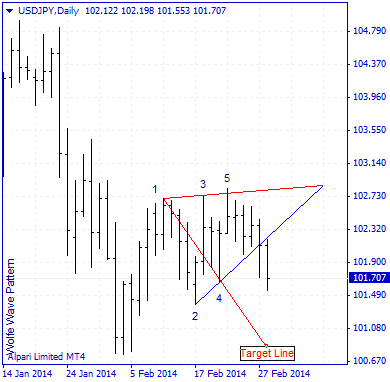
According to the formed movements in Daily time frame, there is Wolfe Wave descending pattern which the 5th point of this pattern is completed and is going toward the target line.RSI indicator( Weekly Chart ) is in saturation buy area and in divergence mode with the price chart and confirms the top price and warns about changing price direction during the next candles.Generally until the resistance level of 105.424 is not broken, price has the potential for descending and reformation in this currency pair.
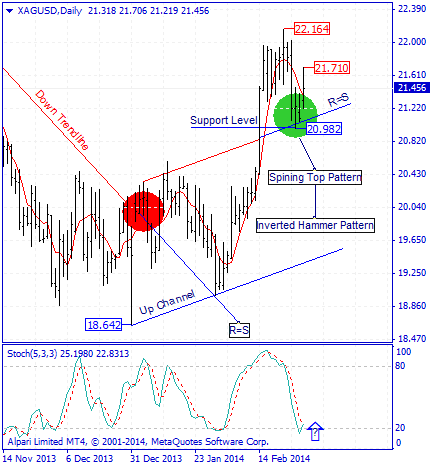
Silver chart since the middle of 2011 till now was in a downtrend accompanied with price reformation that sellers were successful in achieving the lowest price of 18.642.Right now price is above 5-day moving average in long term time frames such as monthly and weekly that shows a consistent uptrend in long period of time. In daily time frame with formation of Inverted Hammer candlestick pattern( Also Spining Top candlestick pattern) in previous candle, there is a warning for formation of a bottom price (need to be recorded) and vulnerability of downtrend.
As it is obvious in the picture below, Price has passed the descending trend line made of 6 peak prices warns about more ascending.In monthly time frame of this currency pair, there is a Morning Star candle stick pattern (With 2 stars) that warns about the potential for formation of a bottom price and ascending of the price for buyers.Generally the first warning for ascending of price is breaking of 21.710 resistance level.
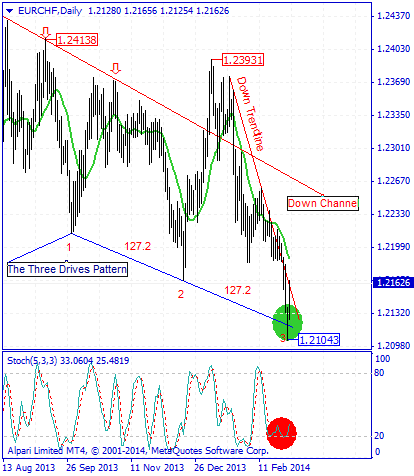
EUR/CHF was in a strong and consistent descending trend that sellers during this descending trend were successful in achieving the lowest price level of 1.21043. Currently in 4H time frame with formation of Ideal Doji candlestick pattern (formation of Doji candlestick patterns which shows indecision market for ascending or descending) price has been stopped from more descending and there is a possibility of formation of a bottom price and finally ascending of the price.
According to the formed movements in Daily time frame, between the top price of 1.24138 and bottom price of 1.21043 there is Three Driver harmonic pattern with ideal ratios of 127.2 and 127.2 that by completion of the 3 point in this pattern, there is warning for ascending of the price. Stoch indicator with the ascending cycle confirms the third point of The Three Drives Pattern and warns about the potential of ascending during the next candles. Breaking the descending trend line (made of 3 resistance level) in 4H time frame is the first important warning for ascending of price in current situation. Generally until the price level of 1.21043 is preserved, price will have the potential for reformation and ascending.
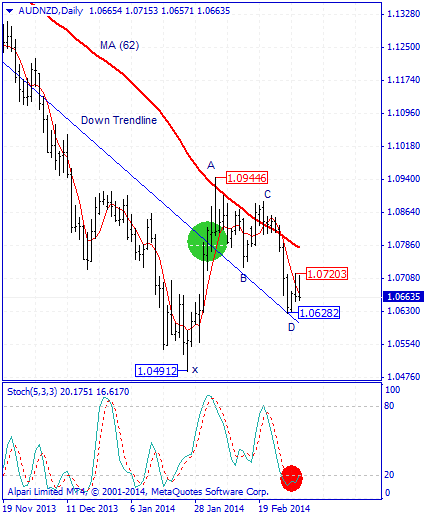
As it is obvious in the picture below, price in AUD/NZD currency pair from the end of 2011till now was in a Downtrend that Sellers have the price close to the supportive levels’ range of 1995 and 2005.Price has formed a bottom price with reaching to the specified supportive levels in the picture below and it has stopped from more descend and has started a little ascend with shows exit of some Sellers from their trades. Currently price in monthly ,Weekly and daily time frames is under 5-day moving average that shows descending of price during the net candles
In Monthly time frame with formation of hammer candlestick pattern, there is a warning for formation of a bottom price (need to be recorded) and vulnerability of downtrend.As it is obvious in the picture below, there is a Gartley pattern between the bottom price of 1.04912 and the top price of 1.09446 that there is a potential for changing price direction from D point of this pattern.As it is obvious in the picture below, Stoch indicator is(Daily and h4) in saturation sell area and warns about ascending of the price during the next candles.Generally according to the technical signs in the price chart until the mentioned supportive levels are preserved, the price has the potential to increase and ascend.
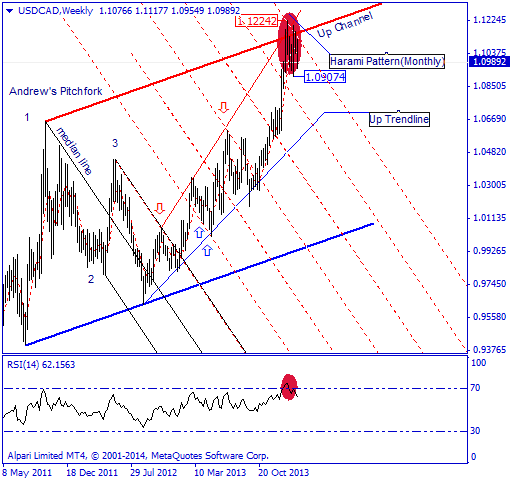
USD/CAD since 16.09.2012 was in strong and consistent Uptrend that buyers were successful in achieving the highest price level of 1.12242.The price has stopped from more ascend by reaching to the resistance edge of Up channel and a top price was created on the resistance line by the buyers retreat.Right now in daily and H4 time frames, the price is under 5-day moving average that shows the descending trend and warns about more descending.
according to the recent descend the Monthly candle in previous Month was appeared as Harami candlestick pattern that shows failure of buyers in reaching to the higher prices and formation of a bottom price in this range (closing of bearish candle).RSI indicator is in saturation buy area and confirms the current top price, also wars about formation of a top price.Generally until the mentioned top price on the resistance channel edge is preserved, the price has the potential for reformation and descending in this currency pair.
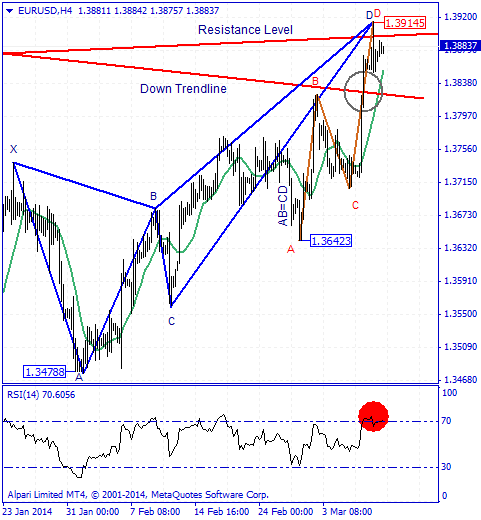
EUR/USD in recent weeks, has been experienced many reformation with a gradual upward trend that Buyers over price increases obtained the highest price of 1.39145. As it is obvious in the picture below, Price has passed the descending trend line made of 3 peak prices and with being above 5-day moving average warns about more ascending.Currently in long-term time frames such as monthly , weekly and daily price is above the 5-day moving average which implies consistent uptrend with potential of further rise in price during the next candles.
In daily time frame of previous Candle the ideal Shooting Star candlestick pattern is seen that has long higher shadow and cause the failure of Buyers in reaching to the higher price and possibility of formation of a peak price in this range. By fixing of Shooting Star candlestick pattern’s warning (closing of descending candle at the end of the day) there is a possibility for descending of price.As it is obvious in the picture below, there is a harmonic butterfly pattern(also AB=CD Pattern) between the bottom price of 1.34788 and the top price of 1.39145 that there is a potential for changing price direction from D point of this pattern. The first warning for descending of the price in current condition is breaking of the supportive level of 1.38521
- S1=1.38521
- S2=1.38235
- R1=1.39145
- R2=1.4000
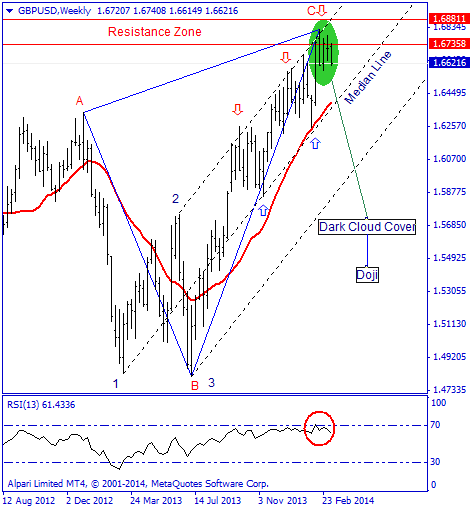
GBP/USD since 09.07.2013 till now was in a strong and consistent uptrend that buyers were successful in achieving the highest price of 1.68168. During this price uptrend, the price has been stopped from more ascending by reaching to the area of important Resistance Zone made of 5 peak prices date back to 2009(also 2011). Right now in daily and h4 time frames, the price is under 5-day moving average that shows the descending trend and warns about more descending. Formation of Dark cloud Cover and Doji candlestick patterns in green area shows indecision market and vulnerability of ascending trend. RSI indicator is in saturation Buy area and with the next cycle confirms the top price of 1.68168 warns about price reformation during the next candles. Generally according to the formed signs until the top price of 1.68168 is preserved, price has the potential of descending.
NZD/USD in recent weeks, has been experienced many reformation with a gradual upward trend that Buyers over price increases obtained the highest price of 0.85213.Currently price in long term time frames(Such as Monthly,weekly and Daily ) is above 5-day moving average and warns about more ascending in long term interval of this currency pair.Price has been stopped from more ascend by reaching to the specified resistance levels in the picture below and with exit of some buyers from their trades at the end of 7th ,10th and 11th days, the Doji , Spining Top and Shooting Star candlestick patterns have been created. These candles shows vulnerability and indecision market in ascending or descending of price that for confirmation it needs closing of a bearish candle
As it is obvious in the picture below , right now in daily time frame ABC descending pattern with the ratio of 161.8 is observable that with the completion of the D point there is a warning about down of price and descend by this pattern.The Stoch indicator is in the saturation buy area and issued the warning of the formation of top price and the falling of the price.Generally until the top price of 0.85213 is preserved, there is a potential for descending and price reformation in this currency pair.
- Free trading apps
- Over 8,000 signals for copying
- Economic news for exploring financial markets
You agree to website policy and terms of use
AUD/USD was in a strong and consistent downtrend during the recent months that sellers were successful in obtaining the lowest price of 0.86581. price with reaching to the supportive level which is shown in the picture below ( made of 2 bottom prices) has stopped from more descend( sellers used this level to exit their trades) and with formation of a bottom price in daily time frame has prepared a field for ascending of price.
With formation of Morning Star(with 2 stars) candlestick pattern in weekly time frame, there is a warning for Vulnerability of downtrend.Currently in weekly and daily time frames price is above 5-day moving average that warns about the potential of ascending of price during long period of time.RSI indicator in daily timeframe (also Weekly Time Frame) is in saturation sell area and also it is in divergence mode with the price chart that warns the potential for ascending of the price during the next candles.The first important warning for ascending of the price according to the technical signs is breaking of the resistance level 0.90481.