Many Stochastic indicators: colored, histogram, crossings, etc...
hey nutmg12..... i've written dozens of indicators that paint the bars but for some reason can't find the stoch..... will write it up for you in a little bit.....
are you wanting audible alerts for the stoch crossing also.....h
I modified the MA crossing indicator so we can have a Stochastic crossing indicator. It has an alert too. It'll alert only once per crossing and not every bar. In addition, it has an e-mail alert. The alert can be turn on or off. You can choose 10 different arrow styles:
Typical alert messages:
EURJPY (M30): Stoch (30,10,10) crosses UP
EURJPY (M15): Stoch (30,10,10) crosses DOWN
Kewl ! The Color Stochastic is not mine.
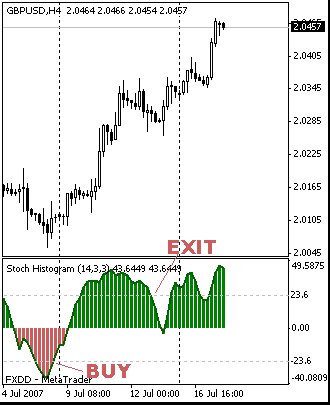
Stoch Histogram. Set 2 levels: 23.6 and -23.6. Buy when the price crosses up -23.6. Sell when the price crosses down 23.6. Green histogram means it's in an uptrend. Red histogram means it's in a downtrend.
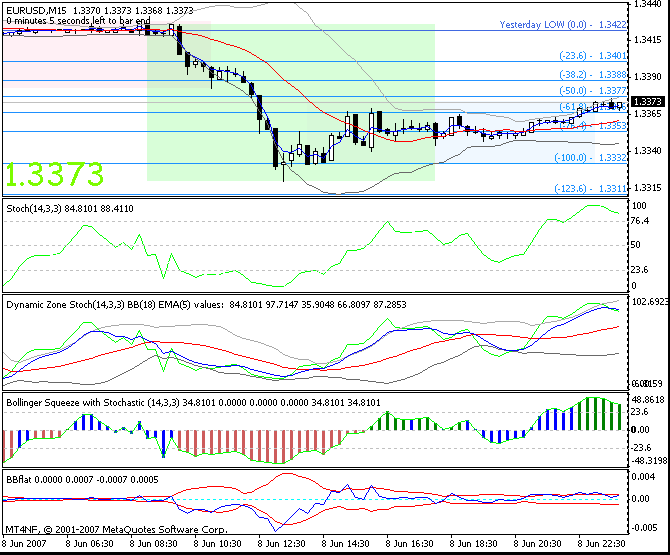
Inspired by the Dynamic Zone RSI, I modified it to use Stoch instead. You make your own rule to trade.
In the top 4 windows:
Lime line = Stoch(14,3,3)
Blue line = EMA(5)
Red line = median line of the Bollinger Band(18) or SMA(18)
Use it together with Bollinger Squeeze v. 8. Blue histogram means it's squeezing; do not trade. Red histogram means it's in a downtrend. Green histogram means it's in an uptrend.
This one is not mine. When stoch is in the overbought/oversold area, the candlesticks will have different colors. I think red candles mean they're in the overbought area. Green means it's in the oversold area.
Thanks for all these indicators man...
A request, can you turn the first indicator to #MTF?
Thanks for all these indicators man... A request, can you turn the first indicator to #MTF?
I knew it that somebody will ask for it. I'm not really a great programmer. That's all I can do. MTF is not really my specialty.
Stoch Candlesticks filtered with Heiken Ashi or Heiken Ashi MA. Heiken Ashi filters can be turn on or off.
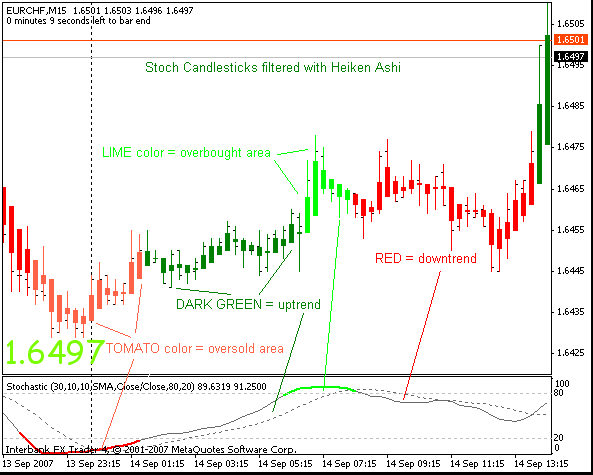
Stoch (6,3,3) to Stoch (24,3,3). Place the template in the template folder and not in the indicator folder.
Google for keywords: "Spuds Stochastic Thread Theory"
- Free trading apps
- Over 8,000 signals for copying
- Economic news for exploring financial markets
You agree to website policy and terms of use
Hello,
Has anyone seen an indicator that changes the color of the candles depending on the current level of the Stoch?
Something like
Green Oversold Under 20
Black between 20 and 80
Red Overbought
A dot over the first candle to close out of OB or OS would be amazing. I think there may already be an indicator like this but I havent been able to find it yet.
Thanks for your help. This site is great!!!!!