A-B-C-D Trade
May 5th London Breakout & Fib Extension
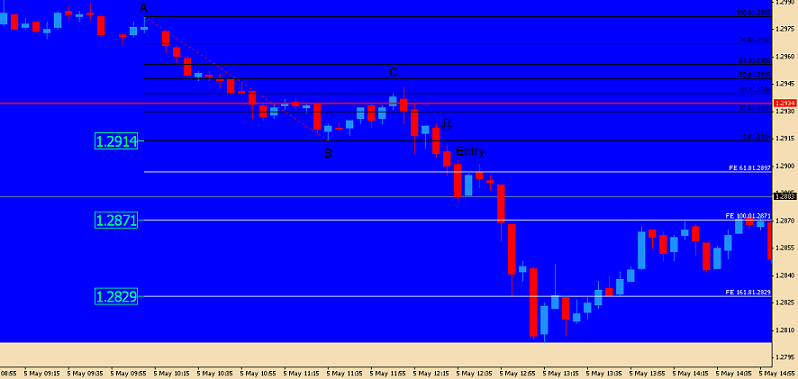
The attached 5-min chart shows a small breakout which would be deemed a false breakout. If we look at a 1-minute chart, it will show that it only extended to the FE 61.8% for a 9-pip gain past the Asian low.
If one entered at that first break of the Asian low (red horizontal line), it would have required the trader to re-measure their fibs. A trader that did not enter also should do this.
I have illustrated the breakout with a 5-minute chart. Moving Point “B” to the low of 1.2914 wilshow a retracement to the 38.2 fib (black fib lines), which we will label as Point “C
Now redraw the fib extension based on the new Point “” to arrive at the exit targets of the FE 100 and FE 161.8 (white fib lines)
Wait for the break of the new Point “B If one was already in the trade, the trader now understands that there may be a larger move, retracement, and fib extension (FE) going on. Entry would have been at about 1.2908 (arrow) based on the opening price of the candle following the closing candle below Point “B
If the trader was already in the trade based on the first breakout, the retracement to Point “C” would not have stopped out the trade. This is due to the original stop loss being placed just above the pivot of 1.2952 (last blue candle prior to first break)
Moving Stop-Loss
Now the stop loss must be moved to just beyond Point “C”, or just above the last pivot of 1.2923 (high of 12:25 candle)Choosing the stop above C would have made the risk distance high, about 45 pips. Using the 1.2923 pivot would reduce that to about 15 pips. Remember to factor in 4 pips to cover the 3-pip spread plus 1 pip just in case.
In any event, always size the number of lots based on your max risk tolerance. If anyone wants me to post a simple sizing calculator spreadsheet (Excel), just ask.
Once the move pivots again at the 12:45 candle, we want to move the stop-loss to just beyond that high of 1.2901 plus 4 pips = 1.2905. Now the trade will be protected against a loss. The reason to select this candle is due to the move respecting that FE 61.8 fib as resistance.
2 candles later, the move hit the FE100 fib for the first profit target level. Trader can elect to exit at this level (or did by auto TP) for a +33 pip win.
Since the distance from Point A to Point B was considered large by me (78 pips), I usually choose to target the FE100.
We are witnessing the Euro under siege. My discipline takes into consideration that heavily trending markets are not usually the case. Therefore, I have to instruct in a manner that is safe year-round. Experienced traders will make adjustments based on their feel for the market.
In an attempt to have your cake and eat it too, one can exit a majority of lots at the FE100 and attempt to take profit with the balance at the FE161.8.
Alternative, one can monitor the Heiken Ashi (on the 5 or 15-min chart) with the balance and ride the trend. The attached chart did not include the Heiken Ashi because I wanted viewers to see normal candles for pivot points to move stops.
Other Notes
Prior to breakout, it was easily determined that the trend was down. As per my first post, I use the Ichimoku.
The FX Sniper Ergodic also had crossed down prior to entry.
Using a stop loss based on a pivot is more scientific than just a number of pips into the Asian Hi/Lo Range (Box).
Practice drawing fibs. You will see how much the market movement will respect this very powerful Support & Resistance tool.
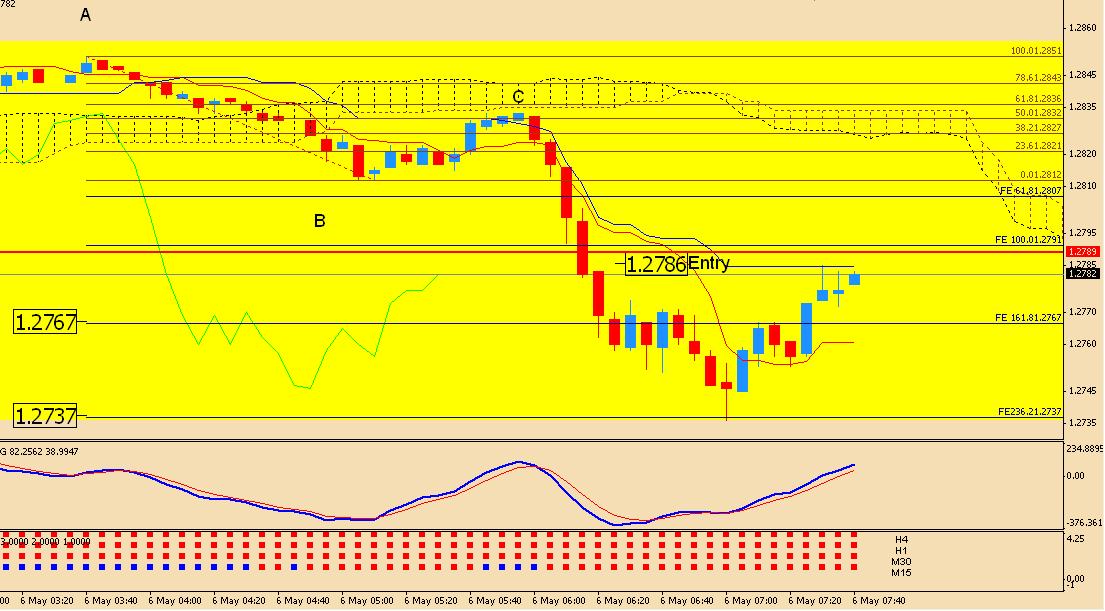
Just concluded an ABCD trade on EUR/USD. Pair broke Point "B" after retracing 50%, establishing Point "C". attached is 5-min chart.
A trader that trades a particular pair would know that major support was also at 1.2789. That was newly established low from U.S. session, and new low for year.
This works out to be a breakout trade from the U.S. session low. Again, we were joining a Move In Progress (MIP). See 1st post for explanation.
Entry at 1.2784. stop-loss placed just above the last pivot of 1.2803 (plus spread and 1-pip cushion =1.2807). Check 1-min chart.
Risk = 23 pips
Profit Targets
FE 161.8 price of 1.2767 (add spread of 3 pips = 1.2770) for + 17 pips
FE 236.2 price of 1.2737 + spread = 1.2740 for + 47 pips
Cheers
Edit: Chart label shows wrong entry price. My graphic artist skills are poor.
Also forgot to mention the I showed the Ichimoku. When market is above or below those "clouds", it indicates up or down trend.
The lower indicator is the Freedom Bar, which were all red, denoting 4 time frames with down trend.
Sniper crossed over confirms sell move.
Since that major support was there at 1.2789, it was not safe to trade the break of Point B price of 1.2812. Unless you were to take profit just ahead of that 1.2789. After deducting spread and some cushion on entry, net gain would probably only work out at about 15 pips.
Also, with such a significant support like that (new year low), there normally is a lot or automatic orders waiting around that price level. we're talking potentially $ billions. There is no guarantee that the move would have hit 1.2789, and may have in fact spiked up against a sell position as it neared that support.
Therefore, waiting for MIP to break U.S. session low was a much safer plan.
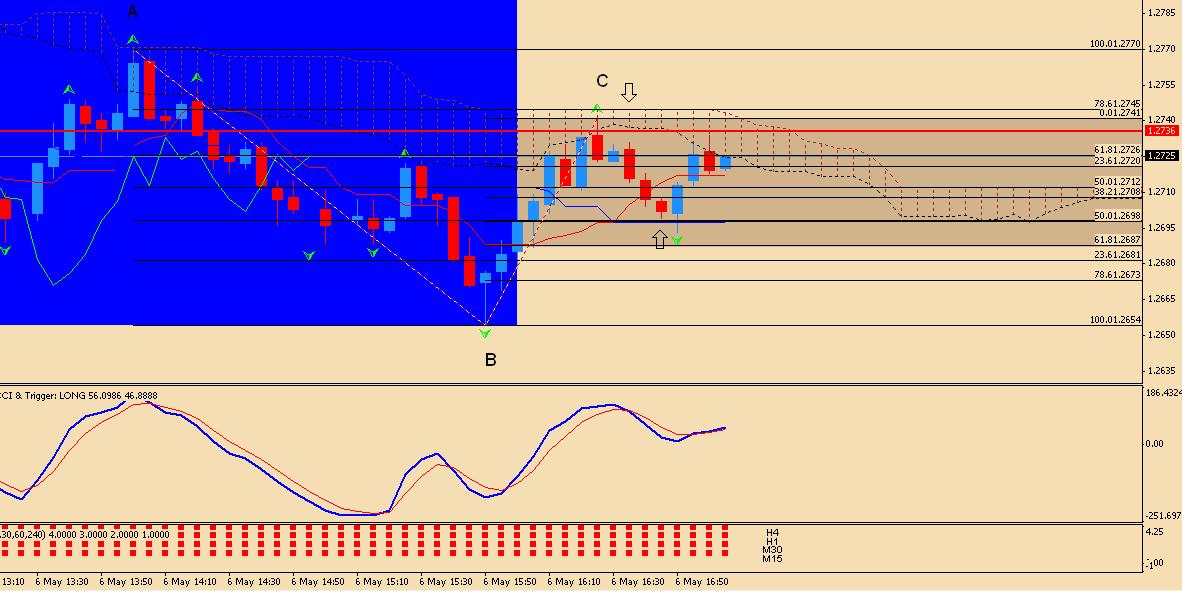
I want to post an ABC Retrace that just occurred. Missed it as I was fooling around with posting charts from last night's London Breakout, which I'll do later. By the time I saw it the entry was not a good risk/reward scenario.
Attached is 5-min EUR/USD. You can see the A-B swing. I drew fibs (wider fibs) and the move stop around the 78.6% retrace fib level. Interesting was that it was also at the Ichimoku cloud. That indicator uses the edges of the clouds as support and resistance. Additionally, we had the Asian low of 1.2736 (red horizontal line). Thus, multiple things were telling us that there is significant resistance there.
I used the Fractal as well. Once that was established, the entry was 1.2728. The Fractal develops after the 2nd candle closes, after the high is established (see down arrow).
Stop-loss would be 4 pips above the high of Point "C" price of 1.2741 = 1.2745. Risk = 17 pips.
Target to take profit:
We measure the retrace from C-D (shorter fibs on chart). It's a little hard to see both but the 2 fib have one thing in common. The up arrow shows that it is both the 50% retrace from B-C and the 38.2% retrace of A-B.
Exit price = 1.2698 + 4 pips = 1.2703. Reward = 25 pips.
Therefore risk/reward was 17/25 and better than a 1:1 ratio, which is the objective.
I decided not to pull the trigger since I was late noticing this and price was already 1.2719. That's O.K. Do not chase, there's ALWAYS another trade. In fact, ABC patterns happen all of the time.
Note that my fib labels (far right) has the price right behind the fib%. See my first post on how to accomplish that.
Cheers
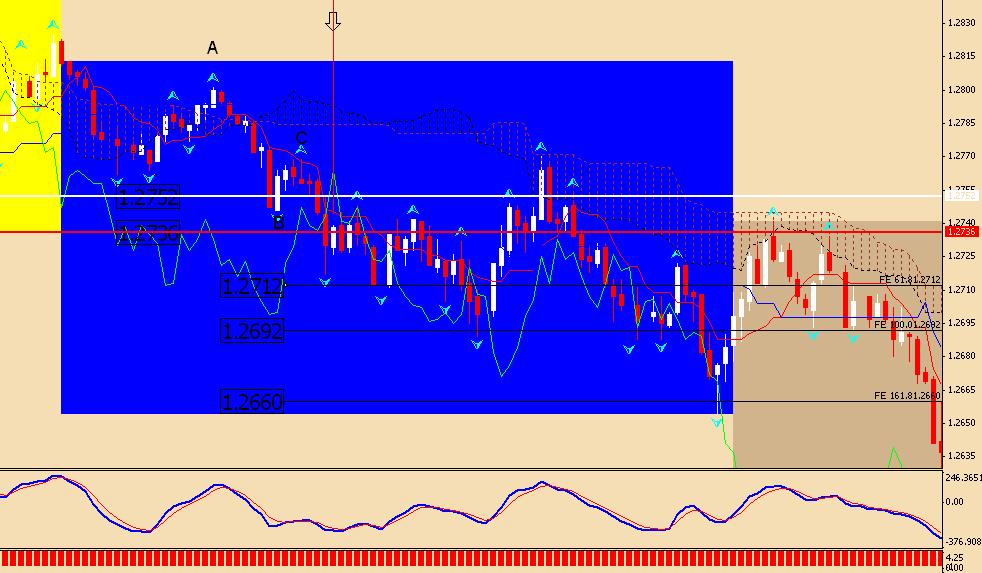
May 6th breakout from the Asian session low of 1.2736 (red horizontal line)
Once again, the breakout was a Move In Progress (MIP). Drawing the fib extension as illustrated on the attached 5-min chart of EUR/USD, saw:
Entry:
1.2729 using opening of 11:50 5-min candle (down arrow). We waited for the break candle to close.
Stop-Loss:
Point C price was 1.2769. Adding 4 pips = 1.2773 stop-loss. Risk = 37 pips.
That’s a large distance. If you use that, you must size the number of lots traded downward quite a bit depending on your max risk tolerance
Alternatively, we can look for a smaller stop by looking at the 1-min chart. The last pivot above our entry would be a 1.2752 at the high of the 11:45 candle.
Add 4 pips = Stop-Loss of 1.2756. Risk = 27 pips.
Take Profit targets:
FE 61.8 of 1.2612 + 4 pips = 1.2616 = +13 pips……Risk/Reward = 27/
FE 100 of 1.2692 + 4 pips = 1.2996 = +33 pips…….Risk/Reward = 27/
FE 161.8 of 1.2660 + 4 pips = 1.2664 = + 63 pips….Risk/Reward = 27/6
The move from Point A to Point B was 55 pips. I consider this a large move and would normally only look to take profit at the FE100.
Attached chart:
Red horizontal line is Asian low of 1.2736
White horizontal line is Stop-Loss of 1.2752
Remember, we set the stop 4 pips above 1.2752. The spread is 3 pips, and we add one for cushion.
We would have been safe even though EUR/USD moved back into the Asian range (Box).
We can see it hanging around the Asian low after bouncing off the FE 61.8.
My guess as to why it was fluctuating around the Asian low is that 07:00 candle low of 1.2636 was a quick probe not recognized by the market/traders. If you use your cross hair tool, you can see that 1.2644 was probably the real Asian low. That is confirmed by chart movement. This is hindsight of course. Each broker’s feed can differ slightly. In this case it made things a bit confusing
Cheers
EUR/USD
Point B price of 1.2654 was established at the end of the European session and was session low, which made it a clean opportunity.
It retraced to the 78.6% fib. Additionally, we have the Ichimoku cloud edge as resistance, was well as a previous S/R of 1.2736 (red horizontal line).
Entry = 1.2642
This was the second candle (18:10) after break candle closed on 5-min chart.
Stop-Loss
Check 1-min chart for pivot.
1.2671 + 4 pips = 1.2675 = 33 pip risk
That's the best we can do as the market was moving good.
Target Profit
FE 100 = 1.2595 + 4 pips = 1.2599 =+43 pip reward
Risk/Reward = 33/43
As most of you know by now, the stock market took a big dip around 18:40 GMT. The EUR/USD did hit the FE 161.8 exactly.
Don't chase the market when this happens as a big spike back can hurt you. It can drag your stop loss and you will still be responsible.
The fibs, when properly drawn, will provide an exactness to your trading.
Cheers
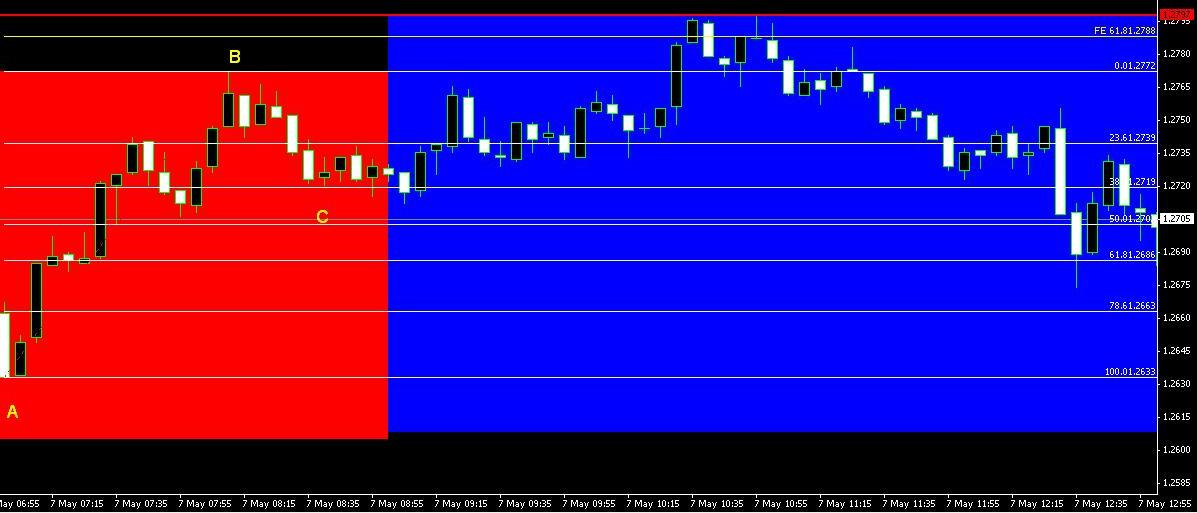
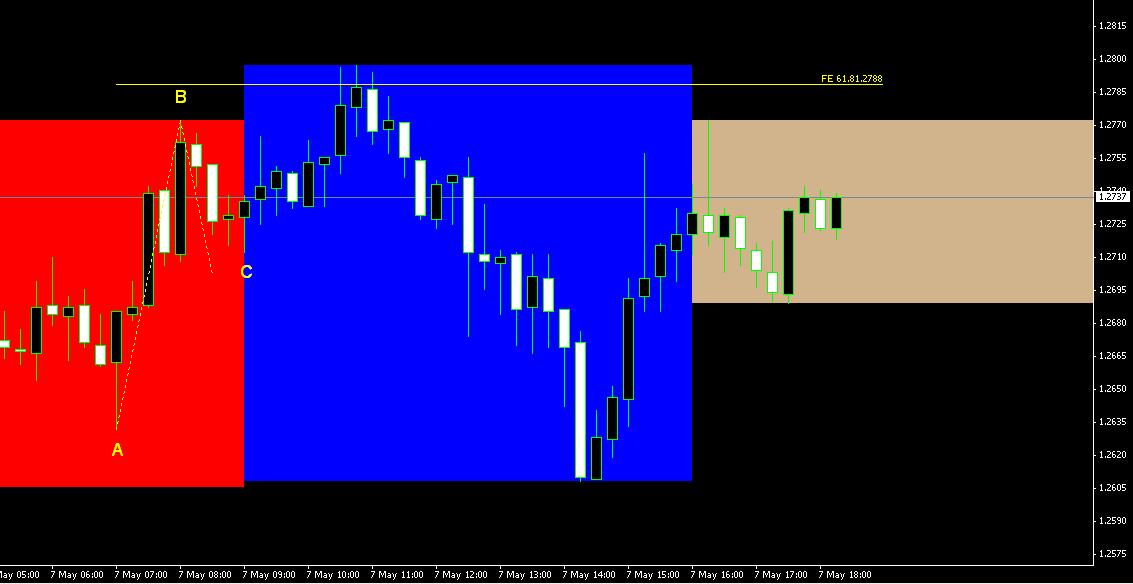
May 7th Asian Session Breakout
Attached are 5-min and 1-hour charts.
We saw a breakout to the upside from the Asian high. It went for 24 gross pips. If a trader targeted a set number of pips, say 15 as taught by glenn5t, then it was a successful trade. Some traders move their stop-loss to break-even after profit is 10 or 15 pips.
Following the ABCD method, here’s what the picture was
Chart 1
Asian high = 1.2772
The breakout failed to move past the FE 61.8. It stopped at 1.2797.
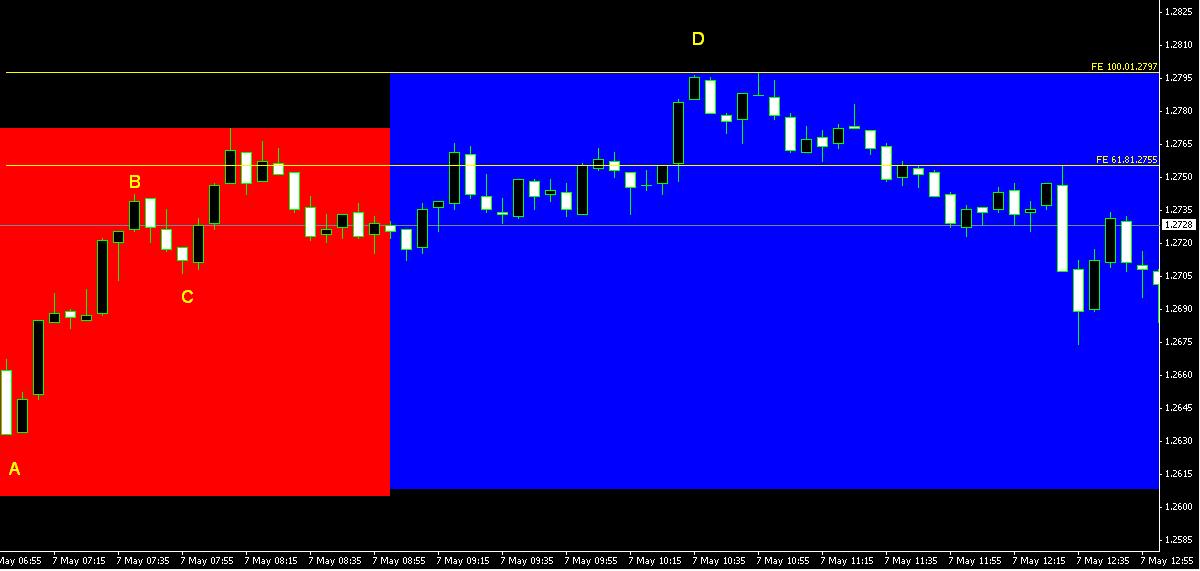
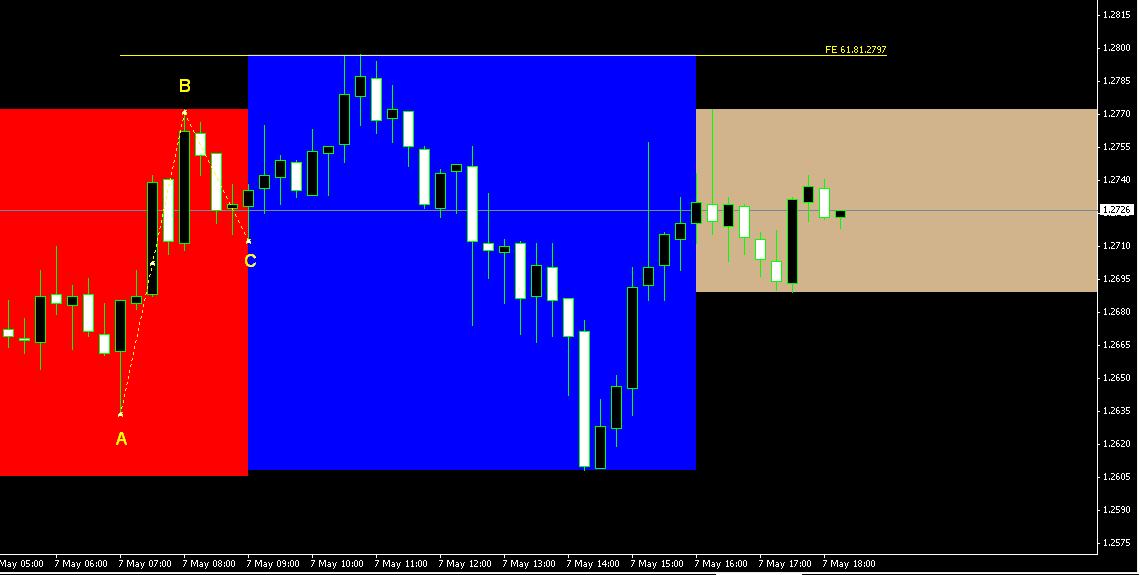
Chart 2
If we, in hindsight drew A-B to have B = 1.2742, then the fib extension will show the move hit the FE 100.
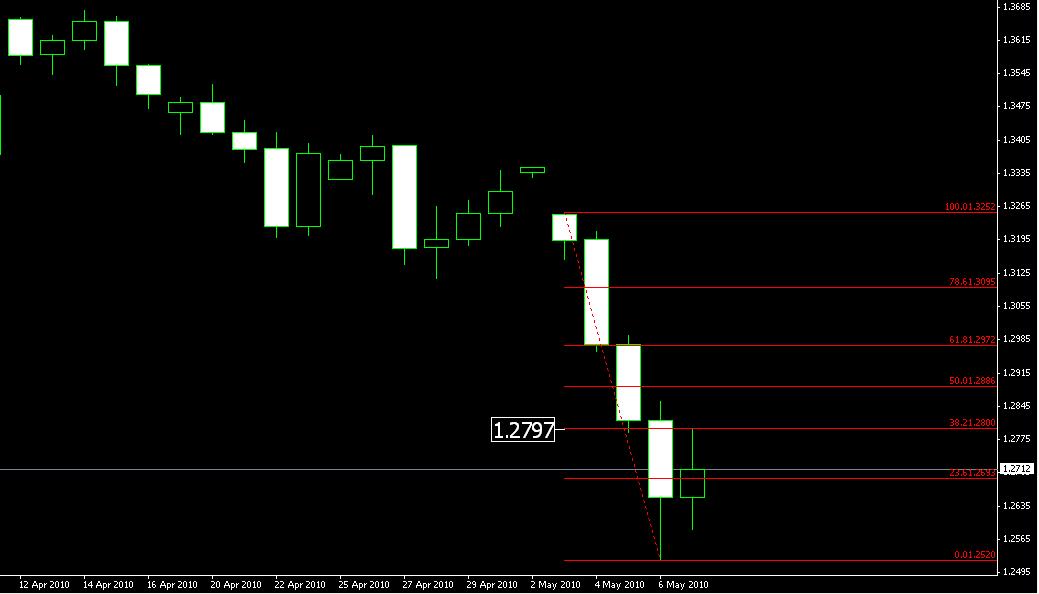
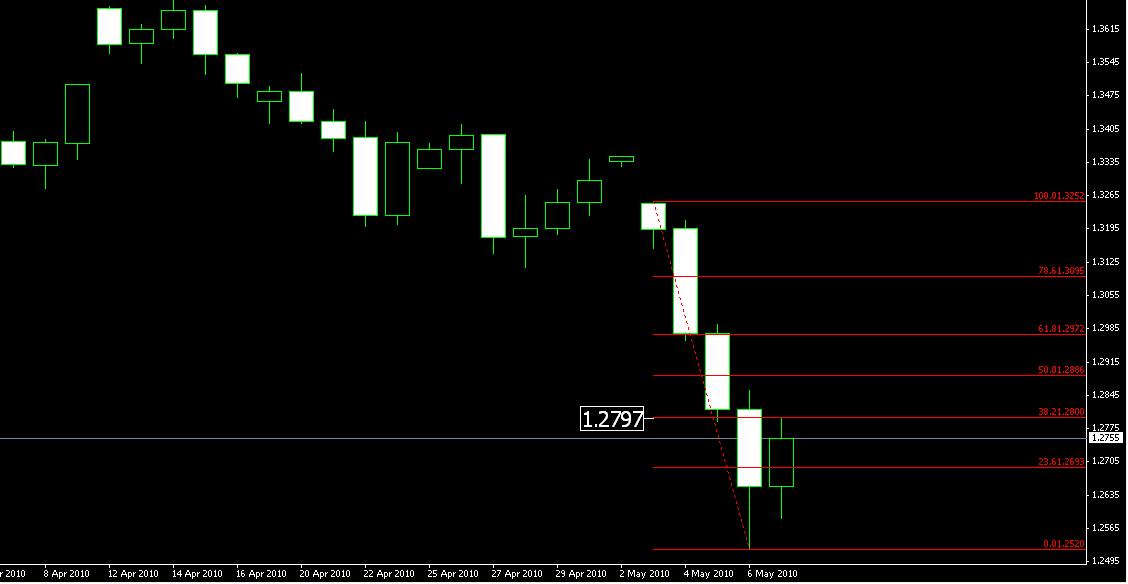
Chart 3
Always monitor a longer term chart. The attached Daily chart shows why the market stopped at 1.2797. It is the 38.2 retrace of the last move down. This is considered a significant resistance level. Knowing this was a major hurdle in advance, can prevent you from entering this trade.
The market was moving fast upwards, as witness by the size of the 5-min 10:30 (GMT) candle as it broke the Asian high.
Based on the Chart 1 A-B and its extension projection:
Entry
1.2785 + 3 pip spread = 1.2788
After close of 5-min break candle. Opening price of next candle.
Stop
1.2742 + 1 pip cushion = 1.2743
Last pivot. Couldn’t get a better pivot, even on the 1-min chart
Profit target
FE 100 = 1.2827 + 1 pip cushion = 1.2826
Risk/Reward = 45/38
Risk = 45 pips
Reward = 38 pips
Notes:
Not a good Risk/Reward scenario from the beginning = red flag.
Part of the reason was the entry price was quite a bit higher than the Asian high, a difference of 16 pips.
The significant 38% retrace price (major resistance) on the Daily chart = red flag.
The distance of the stop-loss was 45 pips. For me, this is too high, even if I size the lots to be traded = red flag.
The Freedom Bars showed the 4-HR in down trend = red flag. Sorry, I did not include the Freedom Bars on the charts.
Most likely, many would have drawn the fib extension based on the A-B points on Chart 1. This happens sometimes, but don’t get discouraged. Assess the trade and look for red flags such as described above
The main message is that there will be times when you don’t/can’t read the market properly, or too many red flags pop up. When you have mastered drawing fibs, you will have enough of an advantage to withstand losing trades. Remember to take your lumps and learn from them. Obviously, always trade with a stop-loss, and size your lots for each trade, conforming to your maximum ris
My next post will teach you a trick on how to use/adjust the Fib Extension tool. MT4 also refers to the Extension as the Expansion. The 2 words are interchangeable.
Cheers
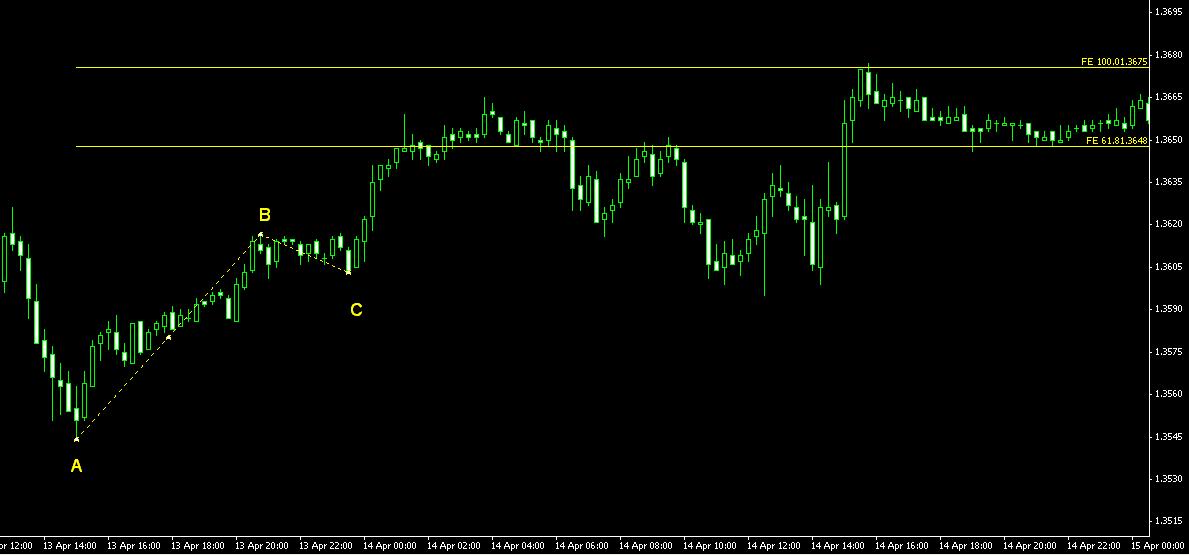
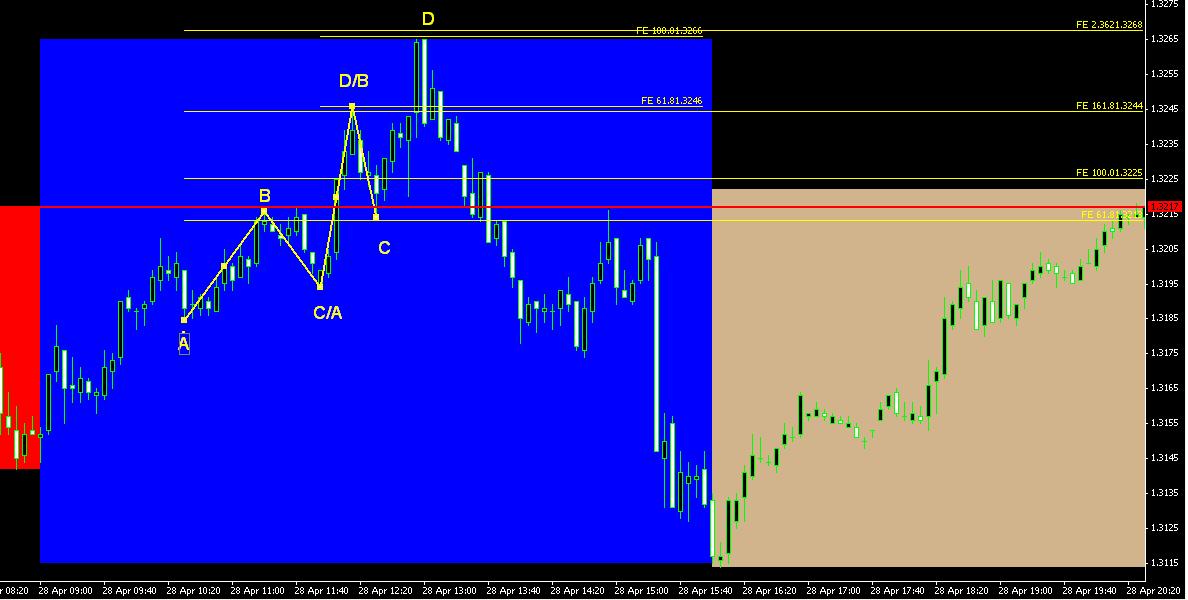
Attached are 4 charts. Charts 1 and 2 are the before and after adjustment to the Fib Extension Tool. Likewise with Charts 3 and 4.
When dragging the FE tool from Point A to Point B, you will see a third dotted line. This is for placement to Point C.
Simply drag that third dotted line the Point C. Sometimes the difference is subtle, and other times it makes quite a difference.
The before and after on Charts 1 and 2, we can see how the EUR/USD hit the FE 100 when we made the adjustment to properly place the third dotted line on Point C.
The difference was much less on Chart 3 and 4. You can see how far off that third dotted line is, in advance.
This is the proper way to use the FE tool.
Cheers
The first chart is the 15-min EUR/USD. You can see the ABC pattern easier.
What we can see:
The Point B is below the Asian low (red box). Why did I pick that one? If we had used the previous ABC pattern in the red box, it clearly shows that it was well on its way to Point D. It was too late to enter and is also against the strategy of trading the London Breakout.
Therefore we had to wait until that C to D move is finished. It did and became Point B and is now set up for the new C-D leg.
The second chart is a 5-min so we can see a little more detail.
You can see that the EUR/USD moved back into the red "Box" (Asian range). That was O.K., as we are still waiting for a break of Point B.
After 2 tries, he 3rd did push through B. You can see the price for Entry, Stop-Loss, Profit Target at FE 100.
Stop-Loss 1.3134 + 4 pips = 1.3138
Entry 1.3112
Profit 1.3078 + 4 pips = 1.3082
Profit pips = 30 pips
Risk/Reward = 26/30
You can also see the Fib Extension tool from A-B-C. Made the aforementioned adjustment to pinpoint that tool to correspond with Point C.
Cheers
I wanted to showcase this chart because it had 2 ABCD patterns.
1st ABCD
Bounced off the Asian high and retraced to establish Point C.
Extended to the FE 161.8
The move A-B was small, so better chance it will hit FE 161.8
2nd ABCD
Leg C pierce the Asian high but bounced off the FE 61.8 of the 1st move.
Hit the FE 100.
Move A-B was 50 pips, and thus I only trade to FE 100.
-------------
You can set your own A-B size rules and trade to FE 100 or FE 161.8.
You can also decide whether you want to enter after the close of a 5-min candle above Point B, or enter earlier.
Always weigh risk/reward and size your lots to max risk tolerance. Sorry to repeat, but it's crucial and often is the difference between successful and not successful traders. You must have a plan. The ABCD can be calculated in advance, viz-a-viz all of the important considerations.
These patterns happen all the time. We just need to have volume to drive the extension. Marrying this technique with the London Breakout provides good opportunities.
The London Breakout is traded by a ton of traders. The difference is that you are now armed with knowledge on how to figure out what the market is doing and where it's going, with precision.
Cheers
Attached are 2 charts.
The 1-Hour chart
Displays an ABC pattern. The move to break Point B (1.2772) and extend upwards is set up now.
The fib extension tool has the FE 100 at 1.2853
Caution, as the move needs to clear a hurdle en route.
Daily chart
As mentioned in a previous post, the 38.2% retrace price of 1.2797 reached May 7th is significant. Allow move to confirm above 1.2800, either with a 5-min candle closing or some other method to your liking.
Once that is violated, we can anticipate the move hitting the FE 100 price of 1.2853.
The next major fib is the 50% retrace at price of 1.2886.
Then the FE 161.8 price of 1.2955
Then the 61.8% retrace fib of 1.2972
---------
This is not advice. Just a learning example. 
Cheers[ATTACH]5766[/ATTACH]
- Free trading apps
- Over 8,000 signals for copying
- Economic news for exploring financial markets
You agree to website policy and terms of use
Hi,
Haven't posted before except to ask for an exit EA. I want to contribute like the other kind posters here. I reference a poster named Glenn that showcased a London Breakout method a couple of years ago, as well as some of the indicators below. Don't really need most of them, but in the event you want to monitor momentum, etc., it will be on your chart.
Have heard that some don't trust the breakout as it can go back into the "Box". Understanding how the market moves with the fib A-B-C-D action will provide more confidence in your trading.
Forex Fib Trading -------A-B-C-D Trade
Chart Intervals: 1, 5, 15, 60
Trigger 1-min
Optional Indicators:
Fractal
ADX Cross
Gann Hi-Lo Activator
Ichimoku
Heiken Ashi
Keitner Channel_v1
FX Sniper’s Ergidic CCI & Trigger
Forex Freedom Bars
MTF Heiken Ashi (sw)
Adjustments:
Add 78.6 fib
Add price display to each fib line. Type in %$ after fib number.
Rules (you can use other breakout entries including break of S/R and channels):
1) London Breakout method. Measure hi/lo from Asian session (Box). Usually, entry is after candle closes outside of that hi/lo Box, the 5-min candle for example.
2) Place Stop-Loss at A) last pivot on 5-min…or B) exit when 5-min candle closes inside of the Box. Remember to factor in spread on Stop-Loss.
3) Size number of lots based on your max risk. If you are using exit B, you must set a stop-loss of a certain number of pips as a safety net. You can use something like 10 pips inside the box (plus spread if any).
4) Target profit based on fib extension from 5-min chart’s last move. If last move was small (less than about 30 pips), usually fib extension will hit 1.618% (FE 161.8%). If last move was large, target smaller level of 1.000% (FE100%).
· You can move the stop-loss when market reaches the FE 100% extension and you either A) target the 1.618% fib, or B) take partial profit at 100% and balance at 1.618% fib.
5) The A-B-C-D movement should always be monitored and understood. When a top or bottom is established, the move will retrace to 38.2%, or 50%, or 61.8%. In some cases it will go 78.6% and 100%.
A = Start of move. B = End of move. C = Retrace Point.
D = is where we want to project the extension.
6) After the move retraces, we look for it to break B. You can set an automatic entry 2 to 3 pips beyond B. Remember to factor in the spread. (See paragraph 10 for Move in Progress).
7) Look at 5-min chart and measure the last move (A-B). Use fib extension tool off of those 2 points. The Take Profit (TP) will be as per #4 above.
8) Always check 1-min chart. It can be used as the trigger in an attempt to get a better entry and/or exit order price fill. Smaller moves can also be identified on the 1-min chart that may not be visible on the 5-min.
9) You should always consider re-drawing fib extensions if a move gets exhausted before your exit. Adjust your Take Profit accordingly.
10) If you are using the Box breakout (such as the London Breakout), the move outside of the box may be a Move in Progress (MIP). Draw the fib retracement and fib extension to ascertain what is going on. If the move stalls and retraces into the Box, you are less jumpy because you can anticipate a retracement to a certain level and watch for a reattempt to break “B”. This is the reason some breakouts go back into the Box. You can now enter when “B” is broken just beyond the Box.
11) Monitor longer time frames for support and resistance (S/R).
12) Always trade with the trend if you are a beginner. Use the Ichimoku and Freedom Bars for that purpose. The market moving above or below the Ichimoku clouds indicates current up and down trend situation. The Freedom Bars track 4 time frames in blue and red to indicate up/down market coloration. A trader can elect to only trade in the direction when all 4 time frames are one color.
13) The FX Sniper crossover aids in confirming trend and directional change. The Multi-Timeframe (MTF) Heiken Ashi also provides crossovers but is less sensitive with overbought/oversold.
14) The Keitner Channel helps visualize oversold/overbought conditions. It also has a middle line for those trading from the outer extremes to that point.
15) The Gann Hi-Lo Activator assists in identifying a reversal of direction.
16) The ADX Cross is displayed with arrows. It confirms change in direction. Is effective on the 15-min chart, but may be best on the 30-min for reference. Use with Fractals, which indicate pivot/directional changes.
Happy trading!